时间:2024-02-14|浏览:208

用戶喜愛的交易所

已有账号登陆后会弹出下载
Making money in a bull run is easy.
Keeping it is the hard thing.
Knowing when to EXIT the market is fundamental.
Here's what valuations the Top 100 will reach
How the market evolved from 2017/2021 to 2024
How many projects will fall off the Top 100 this cycle
The valuations at the cycle top + The lindy effect
What you should NOT do now
Also, If you have attention deficit disorder, you won't be able to make it to the end.
So don't even bother reading it.
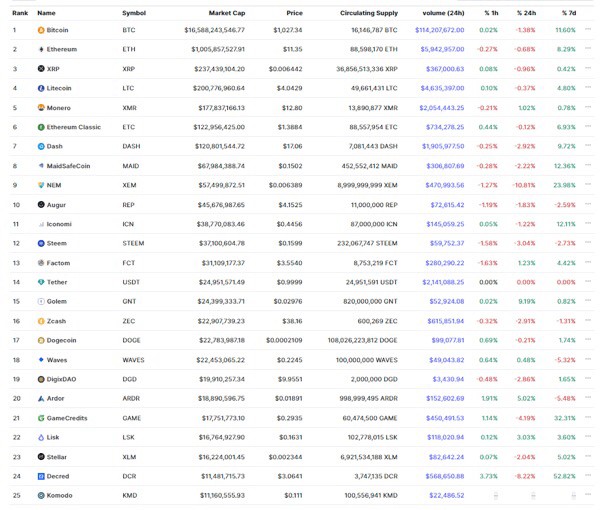
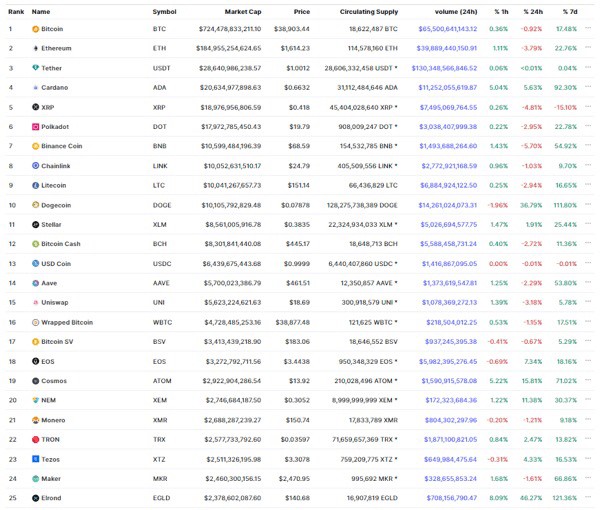
February 2017/2021: 1st - 25th Ranks
From the top 25 of 2017, 4 projects managed to remain in the top 100 in February 2021.
10 out of these 14 are still in the top 100 as of Feb 2024
February 2017/2021: 26th - 50th Ranks
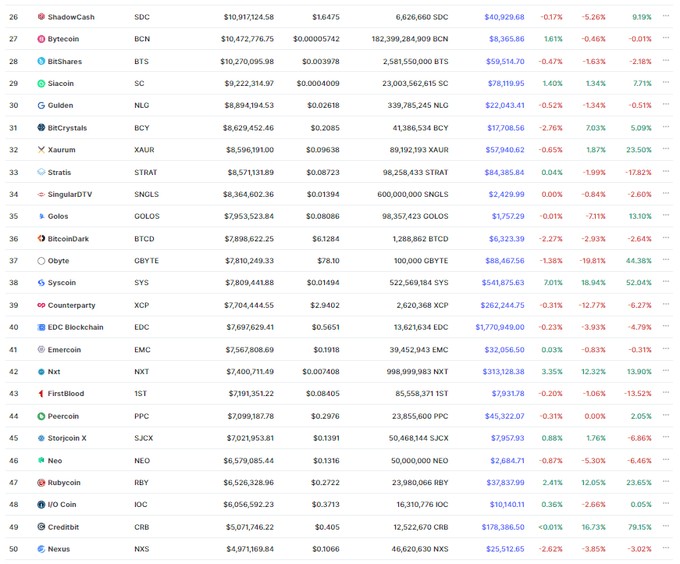
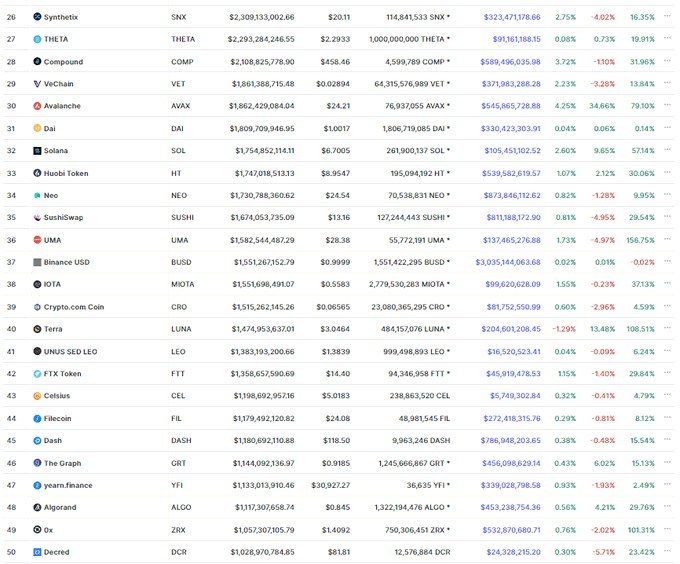
Of these 25 projects, only 2 managed to remain in the top 100 in February 2021.
Of the 25 projects of 2021, only 10 managed to stay at the top as of Feb 2024
Most of the projects didn't make it.
February 2017/2021: 51st - 75th Ranks
Now that we head to the 2nd half of the leaderboard, the cut becomes more aggressive.
Only 1 project made it to Feb 2021. That same project isn't in the top anymore.
Same for Feb 2021 - Feb 2024. Only 5/25 projects managed to survive.
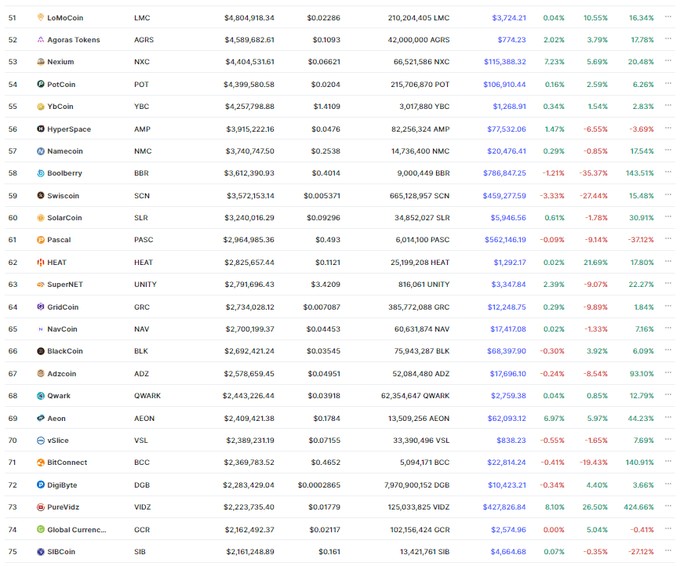
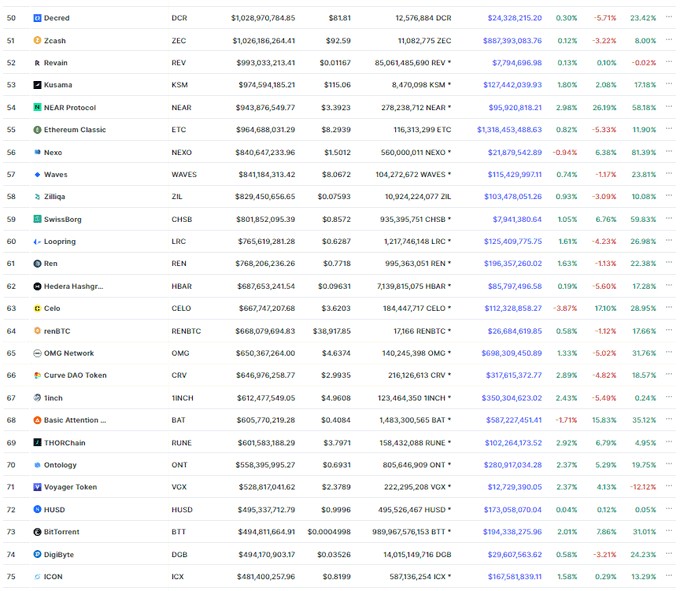
February 2017/2021: 76th - 100th Ranks
0/25 projects → February 2021
8/25 projects → February 2024
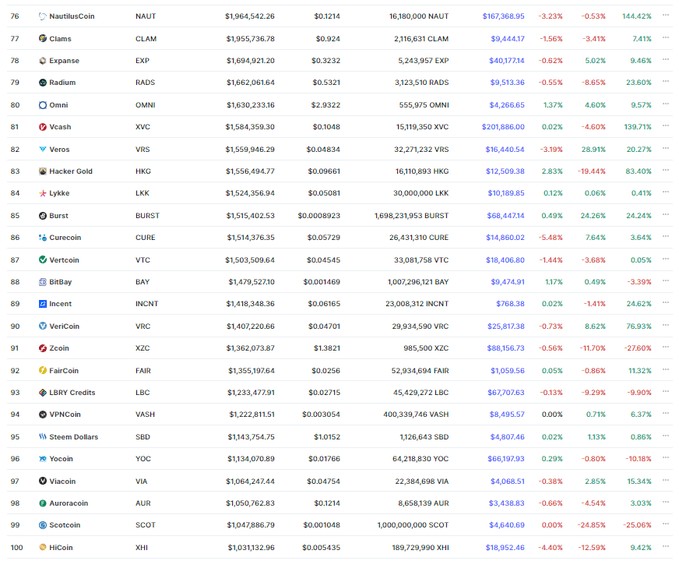
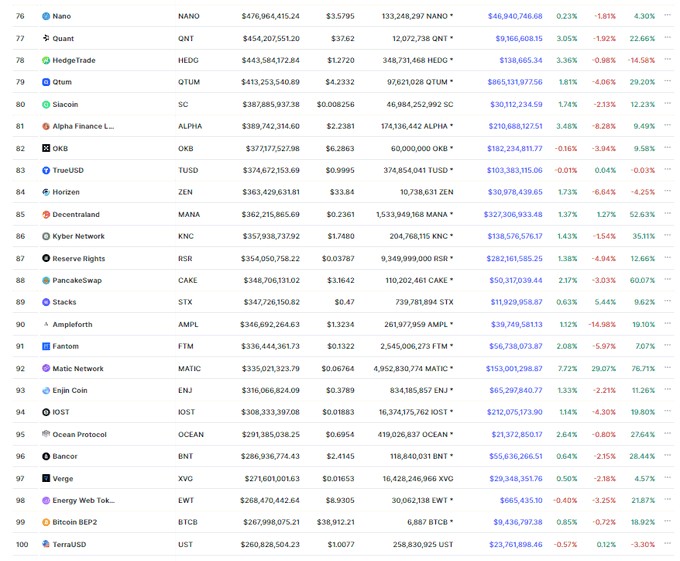
Over these three periods, these were the valuations of the sector:
Total Crypto Market Cap February 2017: $20B
Total Crypto Market Cap February 2021: $1.25T
Total Crypto Market Cap February 2024: $1.81T
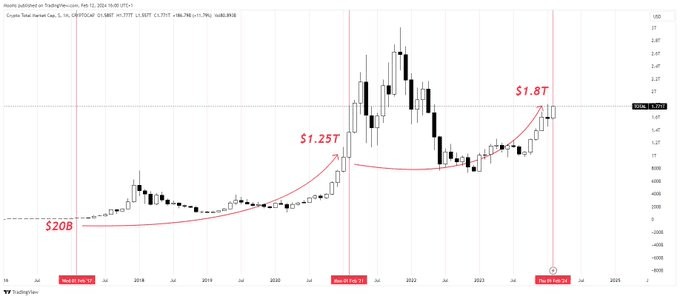
The market did a 63x from Feb 2017 to Feb 2021. 83/100 projects didn't survive over this period.
The market did a 1.45x from Feb 2021 to Feb 2024. 54/100 projects didn't survive over this period.
We have, on average, 19 projects going out each time the market cap doubles.

Now, let's assume that in February 2025, the total crypto market cap will be around $7.8t, based on a $180k price for $BTC and a 45% BTC dominance.
A 4.3x from where we stand right now.
Market Cap multiplier * Average projects going out = Total projects falling off the Top 100
4.3 * 19 = 76 projects
But,
We're missing one thing.
As the market matures, projects have better fundamentals and higher market caps, managing to remain in their positions.
A higher total crypto market cap → more probability projects have to survive.
“The longer something has existed, the longer it is likely to continue existing.”
Simply, the more cycles a project survives, the more probability it will have to stay around.
Indeed, 11 projects of the Feb 2017 Top 100 made it to 2024, while for the 2021 Top 100, the number goes up to 47 projects.
An increase of 40%.
Even if all these are just assumptions, we can project another 40% for this cycle, passing from 47 to around 65 projects managing to survive.
This means that of the top 100 we have today, ~35 will be replaced over the next 1-2 years.
Now that we have seen how the market might behave, let's try to project at what valuations we should sell and exit it
At the top of the last cycle, alts (excluding BTC + ETH + Top 3 stables) had a 40% dominance on the market.
On that same peak, $BNB, the 3rd biggest project, had a 4.3% dominance.
So, if we assume a 4-5% dominance, with a $7.8t crypto market cap, the 3rd biggest project would top around $312-$390b of market cap.
45% dominance * $7.8t market cap = $3.5t of market cap for altcoins.
With the same methodology, in 2025, the following ranks (excluding USDT) could top at these valuations:
#4 → $224b - $280b
#5 → $172b - $215b
#6 → $165b - $207b
#7 → $117b - $147b
#8 → $83b - $104b
#9 → $80b - $100b
#10 → $67b - $84b
With the same process, you can calculate any other position.
For the lazy ones, here are some indicative ranges for when to sell your tokens:
#11 - #25 → $64b - $24b
#26 - #50 → $21b - $11b
#51 - #75 → $10b - $6b
#76 - #100 → $6b - $4b
We're far away from these valuations, so if you have been sidelined until now, know there is still a long way to go.
Make sure to not be left behind and put all you biases aside.
This one in particular
Anchoring is a behavior where irrelevant information is used instead of other references.
Recent example, you heard about $TIA at $3. Afterward, it did a 2x, so you thought it was too late and didn't dive into it.
It went up to $20.
In the next writeup I'll share which projects I believe will be among the 35 that will fall off the Top 100 so make sure to follow
Oh yeah! The Tip features is working fine


